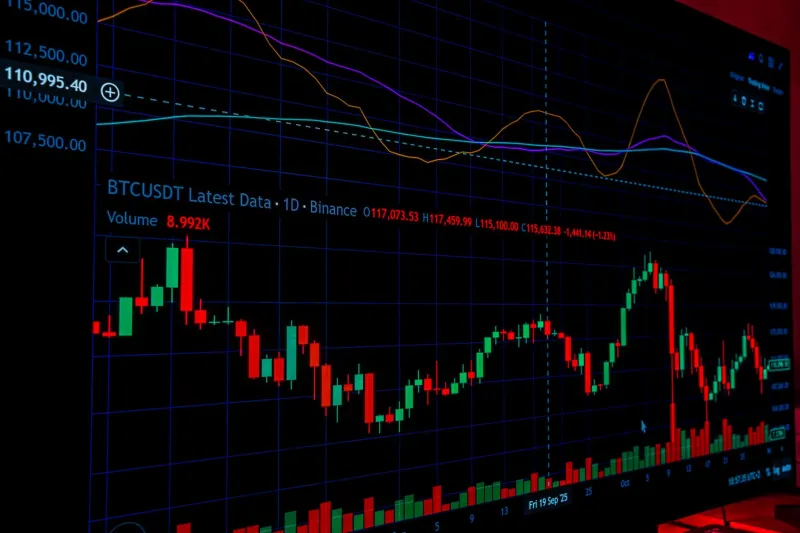
When the Crowd Arrives Late: Decoding Volume Climaxes Before the Reversal Hits
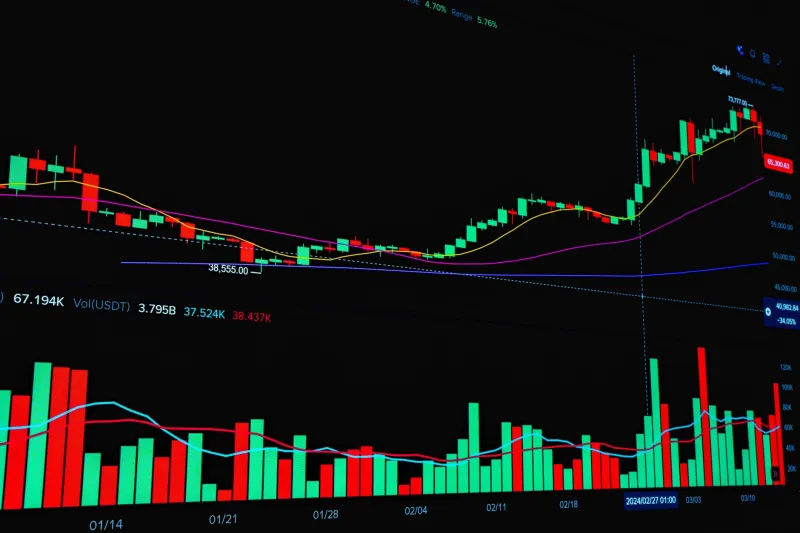
There is a moment in every powerful market move when enthusiasm peaks and participation surges. Screens light up. Financial media declares a new paradigm. Retail traders flood in with fresh capital, convinced they are joining a trend with runway ahead. Volume swells to historic proportions. And then, quietly, the move ends.
This pattern repeats across asset classes, time frames, and market cycles with unsettling regularity. Volume, one of the most closely watched indicators in technical analysis, is also one of the most systematically misread. For traders who aspire to operate at a higher level of market literacy, learning to distinguish genuine accumulation from exhaustion-driven volume surges is not a refinement — it is a foundational skill.
The Allure of Volume as Confirmation
The conventional reading of volume is straightforward: rising prices accompanied by rising volume confirm bullish trend strength. The logic feels intuitive. If more participants are buying, demand must be robust. If transactions are accelerating, conviction must be high.
This framework holds — until it doesn't. And the moments when it breaks down tend to be the most expensive for those who follow it uncritically.
The problem is that volume measures activity, not intent. A surge in volume tells you that a large number of shares changed hands. It does not tell you whether those shares moved from weak hands to strong ones, or the reverse. It does not reveal whether buyers were initiating new positions or covering short exposure. And critically, it does not distinguish between institutional accumulation and retail capitulation dressed up as conviction.
What a Volume Climax Actually Looks Like
A volume climax — sometimes called a selling climax or buying climax depending on context — occurs when volume reaches an extreme reading relative to recent history, often accompanied by an accelerating price move and widening intraday ranges. On the surface, it appears to confirm the prevailing trend with unusual force.
Consider the behavior of meme stocks during the retail trading surge of early 2021. Tickers like GameStop and AMC saw volume figures that dwarfed anything in their trading histories. To the uninitiated, this looked like unstoppable momentum. To those reading the tape more carefully, the expanding volume at elevated price levels, combined with increasingly erratic intraday reversals, was a textbook signal that distribution was occurring — that is, sophisticated participants were offloading inventory into the crowd's enthusiasm.
A similar dynamic played out in crude oil markets during the 2022 commodity surge. As WTI crude approached multi-year highs, volume spiked dramatically in the final weeks of the advance. Rather than signaling the beginning of a sustained breakout, that volume marked the point at which speculative longs were fully committed and institutional sellers found the liquidity they needed to exit.
Accumulation Volume vs. Exhaustion Volume: The Key Distinctions
Developing the ability to separate these two phenomena requires moving beyond raw volume readings and examining the surrounding context.
Price-to-volume relationship: During genuine accumulation, volume tends to expand on up days and contract on down days within a base or consolidation. The pattern is measured and deliberate. During exhaustion, volume surges occur on wide-range candles that often close away from their extremes — long upper wicks on daily charts are a particularly telling sign that sellers are absorbing buying pressure at elevated levels.
Relative volume vs. absolute volume: A stock trading at five times its average daily volume is more significant than one trading at twice its average. But context matters. If a stock has been trending for months and volume has been gradually rising, a sudden acceleration to ten times average near a round number or prior resistance level deserves extreme scrutiny. The question to ask is not how much volume, but whether this volume represents new participants entering or existing participants exiting.
Intraday structure: Exhaustion volume frequently presents with a specific intraday signature — a powerful gap or opening surge followed by a gradual fade. The stock opens with apparent conviction, attracts momentum buyers, and then slowly deteriorates as the sellers who created the opening gap continue distributing into strength. By the close, the day's range tells a different story than the morning's narrative.
Breadth and sector context: A volume spike in a single name that is not accompanied by broad sector participation is more likely to reflect stock-specific dynamics — earnings, news, or short-squeeze mechanics — than a durable institutional accumulation campaign. Genuine sector rotation tends to show up in multiple names simultaneously with more orderly volume patterns.
The Capitulation Disguised as Conviction
Perhaps the most counterintuitive insight in tape reading is that the loudest, most emphatic volume often represents capitulation — not conviction. This is particularly evident at market bottoms, where the final selling panic produces the highest volume readings of the entire decline.
The March 2020 COVID-related selloff provides a clean example. The highest volume days of that decline occurred in the final week before the low. Retail investors who had held through the initial drop finally surrendered, generating enormous volume at precisely the moment the market was about to reverse violently higher. Those who read that exhaustion volume correctly — noting that selling pressure was accelerating even as institutional buyers quietly absorbed the supply — were positioned for one of the most powerful recoveries in modern market history.
This dynamic recurs at tops as well. The buying climax that precedes a significant reversal often looks, in the moment, like a decisive breakout. Prices accelerate, volume explodes, and the media narrative shifts to justify the move. What is actually happening is that the last wave of buyers is being accommodated by sellers who have been waiting for exactly this level of liquidity.
Building a Framework for Volume Interpretation
Applying these concepts in real time requires discipline and a structured approach.
First, establish a volume baseline. Know what normal looks like for any instrument you trade. Unusual volume is only meaningful relative to what came before it.
Second, always examine where price closes within the day's range on high-volume sessions. A close in the upper third of the range suggests buyers are in control. A close in the lower third on heavy volume suggests distribution, regardless of whether the day's net change was positive.
Third, look for confirmation across time frames. A daily volume climax that is also visible on the weekly chart carries significantly more weight than one that appears only on shorter time frames.
Finally, resist the narrative. Volume spikes generate media coverage, social media buzz, and peer pressure to participate. The trader who can step back from that noise and ask whether the volume is creating the move or ending it has a meaningful edge over the reactive crowd.
The Edge in Reading Exhaustion
Markets are ultimately a mechanism for transferring wealth from those who misread information to those who interpret it correctly. Volume is among the most visible and widely available data points in any trader's toolkit, which is precisely why it is so frequently misunderstood.
The liquidity that surges at a move's climax is not confirmation — it is opportunity. For those positioned correctly, it is the moment the crowd provides the exit. For those who arrive late, it is the moment they become the exit liquidity themselves.
Learning to read the difference is not about having access to proprietary data or sophisticated algorithms. It is about developing the patience to observe market behavior honestly, the discipline to question what appears obvious, and the analytical framework to distinguish signal from noise when the volume is loudest.